.svg)
Subscribe to our newsletter and get insights on how to grow your personal brand.
Thank you! Your submission has been received!
Oops! Something went wrong while submitting the form.
.svg)


When you hear "Alto New York," don't think of a company or a building. Think of it as the real-time stock ticker for New York real estate. It’s the live market data coming straight from Altos Research, giving you a weekly pulse on one of the most dynamic property markets in the world.
Forget those stale, quarterly reports that tell you what happened three months ago. The data from Alto New York is your real-time map of the city’s economic tides, showing you precisely how buyers and sellers are behaving right now. For any serious professional, this isn't just about property values; it's about understanding the raw forces of supply and demand in a global financial powerhouse.
This is all about getting ahead of the curve. Instead of reacting to old news, you can spot trends as they form and sharpen your strategy before anyone else. That kind of foresight is pure gold, whether you're an investor, a real estate pro, or just keeping an eye on the city's economic health. To really make this data work for you, it’s crucial to understand how to do market analysis for real estate agents like a seasoned pro.
Metrics from Altos Research, like the Market Action Index (MAI), are designed to give you an instant read on the market's temperature. A high MAI? That’s a seller's market, and prices are on the rise. A low MAI signals a buyer's market, where you'll find more room to negotiate.
For a real-world example, recent data for New York's ultra-luxury single-family homes showed a jaw-dropping median list price of $6,500,000. At the same time, the Market Action Index was sitting at 30, pointing to a slight buyer's advantage even as the market found its footing.
This visual really drives home what the key data points are showing us right now.

To make this even clearer, let's break down the key metrics into a simple table.
This table gives you a quick-glance summary of the metrics defining the current Alto New York real estate landscape.
What the data and the chart are telling us is that while New York real estate remains a high-stakes game, the current climate is giving buyers a bit more breathing room than they've had in a while.
To really get what the Alto New York data is telling you, you have to look past the raw numbers. These metrics aren't just digits on a page; they're the pulse of the market. They tell a story about supply, demand, and where the economic winds are blowing.
Think of it like this: the market is a complex machine, and each metric is a different gauge on the dashboard. You can’t just look at one—you need to read them all together to understand what’s really happening under the hood.
The Market Action Index, for instance, is your quickest gut check. Is the market hot or not? A score over 30 tells you it's a seller's market, where properties are moving fast. Below 30, and you're in a buyer's market, with more options and room to negotiate. It’s the first number I look at to get a feel for the market's energy.
Then you have the Median List Price. This isn't just a number; it’s a measure of confidence. When sellers are asking for more, it usually means demand is strong, or maybe a wave of high-end properties just hit the market. It sets the tone for what buyers should expect to pay.
Knowing the definitions is one thing. Connecting them to what’s actually happening on the street is where the real advantage lies.
Take Days on Market (DOM). I think of this as a "freshness date" for a listing. If the DOM is low, it means homes are getting snapped up almost as soon as they're listed. That signals intense competition. But if the DOM is high? It tells you the market is slower, giving buyers the upper hand.
And of course, there's Inventory Levels—the total count of homes for sale. When inventory is tight, scarcity kicks in, and you see prices climb and bidding wars break out. When there's a flood of inventory, it's a totally different game. Buyers have more choices and less pressure.
These metrics don’t exist in a vacuum; they're all tied together. A drop in inventory will almost always lead to a lower DOM and a higher Market Action Index. For any professional, truly grasping these connections is crucial for building a strong strategic position in the market. It’s about moving from just knowing the data to understanding the story it tells.
The data from Altos Research, shown below, pulls all of this together visually.

You can see how it tracks everything in real-time—price movements, inventory shifts, and the overall market pulse. It’s about turning abstract numbers into something you can actually use.
When you start weaving these data points together, you can build a solid narrative about where the New York market is right now and, more importantly, where it’s likely headed.
This isn't about memorizing stats to sound smart. It's about using the data to see around the corner, spot opportunities before anyone else, and show you have a deep, genuine understanding of what makes this city tick.
Here’s how different pros can put these numbers into action:
At the end of the day, these metrics are your building blocks. Learn how to read them, and you’re no longer just looking at data—you're holding a strategic asset that gives you a serious edge.
Sure, looking at the broad market gives you a general feel, but if you want to understand where real economic power moves in New York, you have to look at the very top. The ultra-luxury tier—the top quartile of single-family homes—plays by an entirely different set of rules. Think of it as a hyper-sensitive barometer for global wealth, telling you exactly how confident the world’s biggest investors and high-net-worth players are feeling.
Getting a handle on this exclusive market isn't just about admiring jaw-dropping real estate. For ambitious founders and CEOs, it’s about recognizing the hard assets that scream influence, success, and a deep understanding of high finance. These properties aren’t just places to live; they’re legacy statements.
So, what gets a property into this elite club? It's a mix of an irreplaceable location, a story steeped in history, and the kind of luxury that feels almost impossible. The inventory is a wild blend of classic, historic brownstones and massive, modern penthouses that own the skyline.
A few key factors are driving the value here:
This trifecta makes the top-tier market much less reactive to small dips and much more of a signal of long-term economic confidence. When you hear leaders talking about the Alto New York market, they're really talking about the trends being set by these exact properties.
The ultra-luxury market is where hard data meets legacy. The numbers don't just show a price; they reveal how much value is placed on history, exclusivity, and lasting influence in the most important city in the world.
The numbers in this segment are genuinely mind-boggling and prove New York's status as a global money hub. We're talking $1,347 per square foot, with the most expensive quartile averaging a staggering $17,500,000 for homes around 6,725 sq ft. And get this—the average age of these properties is 124 years old, hammering home the value of heritage. You can dig into more data on these top-tier properties to see just how much they shape the entire market.
For any rising CEO or entrepreneur, these insights are pure gold.
When you can speak knowledgably about the forces shaping New York's most exclusive real estate, you're signaling a sophisticated grasp of wealth, investment psychology, and the market itself.
It instantly positions you as more than just another player in your industry—it makes you a commentator on the larger economic stage. That's how you build a personal brand that communicates authority and pulls in a network of equally influential people who see and respect that you get it. The Alto New York data is the perfect fuel for that fire.
The ultra-luxury market gets all the headlines, but the real story of Alto New York is so much bigger and more interesting than that.
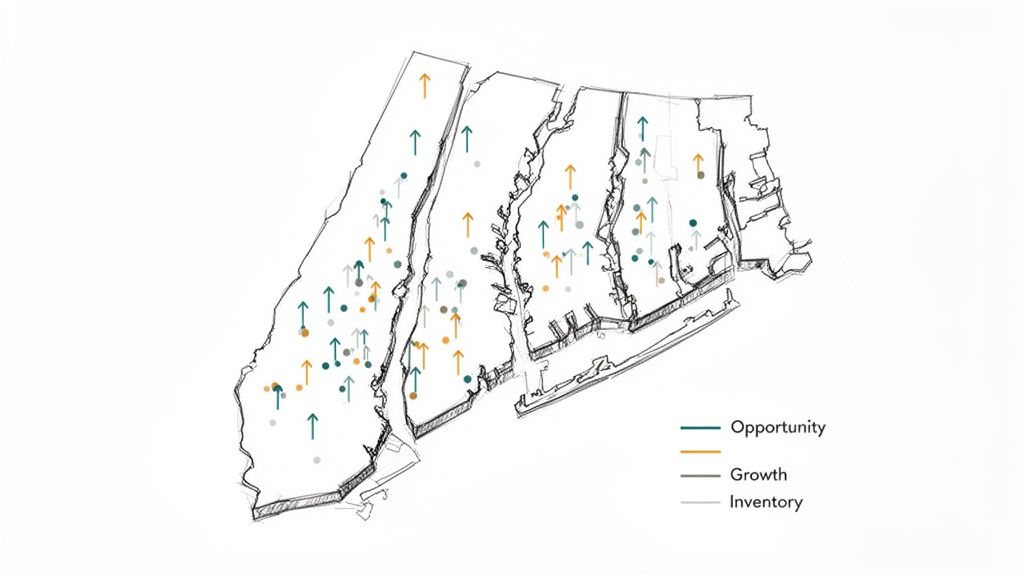
To really get a handle on this market, you have to look past the glitzy penthouses in Manhattan. The city is a mosaic of different neighborhoods and boroughs, each with its own vibe and its own growth story. If you're trying to build influence here, understanding that bigger picture is non-negotiable.
It’s like trying to win a chess match by only paying attention to the king and queen. A leader who can talk about trends in Queens or Brooklyn with the same confidence they have about the Upper East Side shows a much deeper, more strategic grasp of what makes this city tick.

Focusing only on the top tier is like trying to gauge a company's health by looking at the CEO's paycheck. The real work, the growth, and the true potential are usually found in the layers just below the surface. By digging into data from all the boroughs, we can find unique entry points and growth stories that give us a strategic edge.
This is where the sharpest professionals separate themselves from the pack. They can spot value where others just see noise, pinpointing neighborhoods on the verge of a boom or finding stable segments in a shaky market. That skill is a massive asset for your personal brand—it proves you can find opportunity anywhere.
Across the board, the New York City housing market has been incredibly resilient. In late 2025, the average home value hit $797,328, which was a 3.2% jump from the year before. Properties were also selling pretty quickly, going under contract in about 68 days on average. This points to a healthy mix of demand and accessibility. You can dig deeper into these city-wide numbers in this real estate market statistics report.
When you understand the unique pulse of each borough, you can tell a much more compelling story. For instance, a spike in median sales prices in an up-and-coming Brooklyn neighborhood tells a completely different story than a drop in inventory in a quiet corner of Staten Island.
A true market expert doesn't just rattle off luxury price points. They connect the dots between shifting demographics in the Bronx, new infrastructure in Queens, and inventory levels across the entire city to paint a complete, actionable picture of where the market is headed.
Here’s how you can put these broader insights to work for you:
This comprehensive view gives you the power to lead conversations with a perspective that is both deep and wide—a key trait of any true leader in this space.
Raw market data is just noise. It doesn't mean anything until you give it a story.
For professionals trying to build real influence, the numbers coming out of Alto New York aren't just stats—they're the raw ingredients for killer content that proves you know your stuff. The secret is turning all those data points into a consistent content pillar. That’s how you go from just another player in the market to the person everyone listens to.
Think about it like this: anyone can read a list of ingredients. But a true expert—a chef—knows how to combine them into something memorable. It's the same with market data. A rookie will just say, "inventory is down." Who cares?
An influential leader frames it differently. They talk about scarcity and value, explaining how a tighter supply in key neighborhoods is a flashing signal for long-term investment strategy. See the difference?
Suddenly, a boring market update becomes a masterclass on economic principles. That’s how you position yourself as the expert everyone wants to follow.
To start building your brand with this data, your entire focus should be on turning numbers into strategic insights. Don't just spit out facts; tell your audience what those facts mean.
For instance, instead of just pointing out that the Market Action Index is stabilizing, you frame it as a sign of market maturity. It’s a return to predictable growth, and that gives people confidence.
Here are a few ways to frame the Alto New York data to build your authority:
The goal is to stop reporting the "what" and start explaining the "why" and the "so what." That’s the pivot. It's what turns dry data into valuable insights and builds an audience that actually trusts your point of view.
Once you've got your narrative, you need to be consistent. It's not a one-and-done thing. You can learn more about how to develop a personal brand and build influence with the right content strategy. And to really turn these insights into a lead-gen machine, you have to pair them with the best real estate marketing strategies.
Your content can take a few different forms. Mix it up.
By consistently putting out this kind of high-level analysis, you create a powerful feedback loop. You're giving your network immense value, and in return, they start seeing you as the undisputed authority on what’s really moving the New York market.
Knowing the numbers behind Alto New York is a great start, but the real power comes from putting that knowledge into action. It's time to turn those market signals into a concrete professional strategy.
This isn’t about you suddenly becoming a full-time real estate analyst. Not at all. It's about building a simple, repeatable system to keep an eye on key indicators and use what you see to build your authority.
The whole point is to translate raw data into commentary that gets the right people to pay attention, growing your network and your influence.
First things first, get into the habit of checking Altos Research every single week. It only takes a few minutes to see where the Market Action Index and the median list price are sitting. Look for the story in the numbers—is the market heating up, cooling down, or just treading water?
Once you have your insights, you need a plan to share them. How you frame the data depends entirely on who you're talking to.
The key is consistency. A single data point is just a number. A consistent stream of insightful commentary, however, builds a digital presence as solid and influential as a Park Avenue address.
By making a habit of tracking these trends and turning them into valuable narratives, you stop being a bystander in the market. You start shaping how other people see it, cementing your reputation as a credible, data-driven expert. This is how you build an influential brand backed by real-world intelligence.
When you start digging into real estate data, a few questions always pop up. Let's tackle the most common ones about Alto New York so you can use these insights like a pro.
If you only have time to look at one thing, make it the Market Action Index (MAI).
Think of it as the market’s pulse. A number above 30 means it’s a seller’s market—things are hot and moving fast. A number below 30 signals a buyer’s market, where you’ve got more room to negotiate. It's the quickest way to get a read on the market's temperature before you dive into the nitty-gritty of prices and inventory.
It's updated weekly. This is a huge deal.
Most real estate reports come out quarterly or even annually, which means you're always looking in the rearview mirror. With weekly data, you’re seeing trends as they happen, not months after the fact. It gives you a massive advantage when it comes to making smart, timely moves.
When you're tracking weekly shifts, you stop reacting to the market and start anticipating it. That's how you build a reputation for being ahead of the curve in any industry.
Let's be real: no single data source is a crystal ball. Alto New York is brilliant for understanding the current health of the market, but it won't predict a crash with 100% certainty.
What it will do is give you the warning signs. Instead of looking for a prediction, look for risk factors:
Watching these indicators helps you play defense long before a downturn hits the headlines. It’s all about spotting the signs and adjusting your game plan.
Ready to turn these kinds of insights into a personal brand that screams "authority"? Legacy Builder is where we help you create high-impact content that puts you at the center of your industry. Let's start building your legacy.


You could – but most in-house teams struggle with the nuance of growing on specific platforms.
We partner with in-house teams all the time to help them grow on X, LI, and Email.
Consider us the special forces unit you call in to get the job done without anyone knowing (for a fraction of what you would pay).
Short answer – yes.
Long answer – yes because of our process.
We start with an in-depth interview that gives us the opportunity to learn more about you, your stories, and your vision.
We take that and craft your content then we ship it to you. You are then able to give us the final sign-off (and any adjustments to nail it 100%) before we schedule for posting.
No problem.
We have helped clients for years or for just a season.
All the content we create is yours and yours alone.
If you want to take it over or work on transitioning we will help ensure you are set up for success.
We want this to be a living breathing brand. We will give you best practices for posting and make sure you are set up to win – so post away.
Subscribe to our newsletter and get insights on how to grow your personal brand.