.svg)
Subscribe to our newsletter and get insights on how to grow your personal brand.
Thank you! Your submission has been received!
Oops! Something went wrong while submitting the form.
.svg)


Let's be honest—if you can't measure your content's performance, you're just guessing.
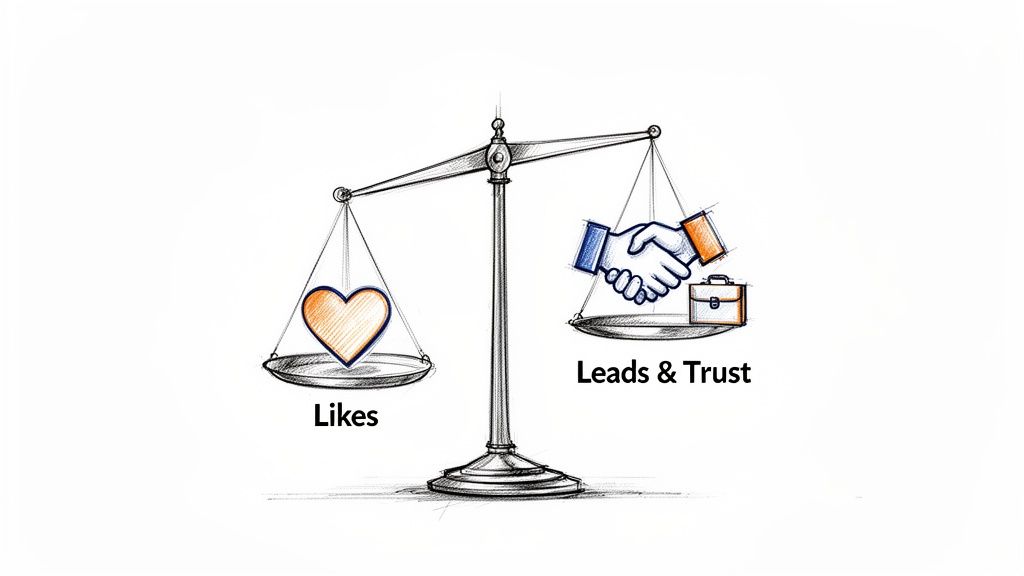
Every post, video, and article needs to have a point. It has to connect directly to a business goal. Stop chasing vanity metrics like likes and shares and start focusing on the meaningful Key Performance Indicators (KPIs) that actually build your business—things like lead generation, community growth, and real authority.
This means ditching a vague approach to analytics and adopting a framework that tracks real influence and ROI.
If you're a founder, consultant, or industry leader building a personal brand, your content is the engine. But how do you know if that engine is actually taking you anywhere or just burning fuel?
The answer is a shift in perspective. You have to move from measuring fleeting attention to tracking sustained impact.
For a professional brand, "performance" isn't about going viral. It's about building trust, generating qualified leads, and cementing your legacy. This guide is your playbook for tying every piece of content to a tangible business outcome. I'm going to show you how to see past the surface-level stats and focus on the data that moves the needle.
The online world is loud. Your audience is smarter and more selective than ever. Shallow engagement just doesn't cut it anymore. With AI-generated content flooding our feeds, people are putting a premium on authenticity and genuine connection.
By 2026, trust signals and real-world actions are set to blow past simple attention stats. Think about it: buyers already value peer mentions 1.4x more than a direct pitch from a brand. That’s a huge shift you can’t ignore.
This is exactly why we're moving toward a more thoughtful approach to measurement. It’s about tracking the right things to ensure your content is building real, lasting authority.
Here's the bottom line: If a metric doesn't help you make a better decision, it's just noise. Effective content measurement cuts through that noise to show you what's actually driving your personal brand forward.
Getting a handle on your content performance is non-negotiable. Here's why:
This guide will be your playbook. We're going to move you past the vanity metrics and show you how to measure your content in a way that reflects genuine influence and accelerates your growth.
You’re posting content, but what does "good performance" even mean?
I see so many founders and professionals get this backward. They obsess over likes and follower counts without ever defining what they’re actually trying to achieve. It’s like getting in a car and just driving, hoping you end up somewhere great.
Your content needs a destination. It has to be directly tied to your bigger business objectives—like building authority, landing clients, or growing a community.
It all boils down to one simple question: What do I want someone to do after seeing my content?
Get that right, and everything else falls into place.
Let's get this straight, because people mix them up all the time. For more on the nitty-gritty, check out this guide on understanding KPI vs. metrics, but here's the quick version.
Your goal is the big-picture outcome. Think "become the go-to authority for leadership coaching."
A Key Performance Indicator (KPI) is how you know you're getting there. It's a specific, hard number you can track.
Metrics are just numbers. KPIs are the numbers that actually matter to your business.
Let’s make this real. Here’s how it looks for different personal brands I’ve worked with:
See the pattern? Each KPI is an action that directly impacts the bottom line. This is how you stop chasing vanity metrics and start measuring what actually grows your brand.
A goal gives your content a purpose. A KPI tells you if you’re actually making progress. If you can’t connect a metric to a real business outcome, it’s not a KPI—it’s a distraction.
Now, let's add another layer. To get the full story, you need to track two types of indicators: leading and lagging. This combo shows you what’s working right now and what’s paying off in the long run.
Leading indicators are your early warning system. They predict future results and tell you if your content is hitting the mark in the moment.
Lagging indicators are the scoreboard. They measure past success and confirm your strategy is actually working. These are often tied to revenue and are slower to move, but they are the ultimate proof.
A smart measurement plan uses both. A high engagement rate (leading) is great, but if it never turns into new client inquiries (lagging), something is broken in your process. We dive deeper into connecting social media efforts to real business results in our guide on how to measure social media ROI for your personal brand.
By tracking both, you start to see the why behind your results. Your leading indicators explain what's driving your lagging indicators, giving you the power to make smarter decisions instead of just guessing.
Not all content is created equal. I see this mistake all the time.
A blog post designed to grab attention has a totally different job than a webinar designed to close a deal. So why would you ever measure them with the same yardstick?
To get a real pulse on your content's performance, you have to match your metrics to the specific purpose of each piece. That means looking at your content through the lens of a funnel: Top of Funnel (ToFu), Middle of Funnel (MoFu), and Bottom of Funnel (BoFu).
Each stage has a different goal, which means you need to be tracking different KPIs.
Think of your top-of-funnel content as your first handshake. Its only job is to attract new people, introduce them to who you are, and build awareness. You're not going for the hard sell here. You're building brand gravity and pulling people into your orbit.
At this stage, your entire goal is reach and attention. Your metrics should tell you how far your message is traveling and if it’s actually capturing interest.
Here’s what to look at for ToFu content:
For example, a founder I worked with created a LinkedIn post about a common industry frustration. The key metric wasn't sales; it was brand mentions. We tracked a 300% spike in untagged mentions across other platforms, which confirmed the post had successfully blasted her brand's reach far beyond her existing network.
This simple flow breaks down how you go from a big-picture goal to the specific numbers you'll actually track.
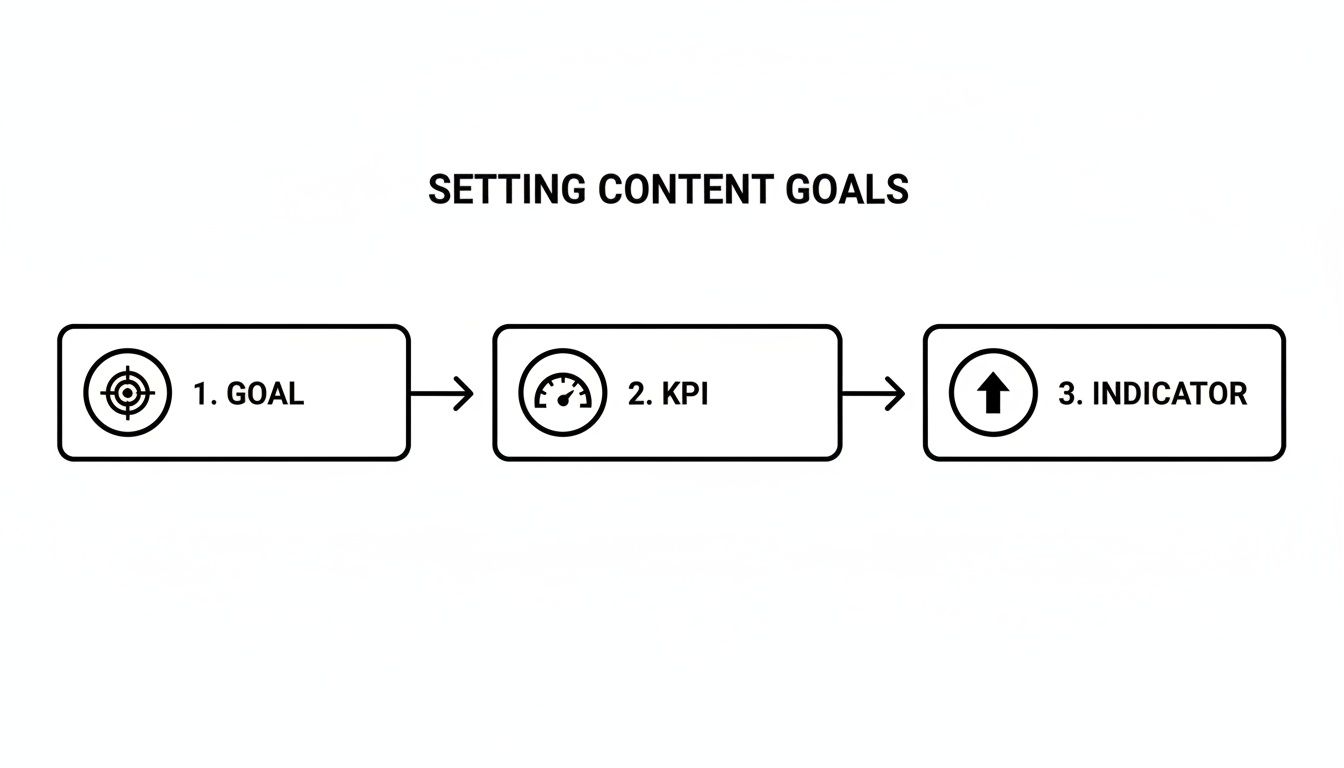
You can see how a broad goal gets distilled into a measurable KPI, which is then monitored through specific indicators. It keeps you focused.
Once you have someone's attention, the middle of the funnel is where the real relationship-building happens. This is where your content needs to educate, build trust, and solidify your position as the expert. You're turning casual observers into engaged prospects.
The focus shifts from broad reach to deeper engagement and lead generation. You need to see if your audience is leaning in and ready to take the next step.
For MoFu content, you're looking for signs of active consideration. A view is nice, but a click, a download, or significant time spent on a page is a clear signal of intent.
Key MoFu metrics include:
Looking ahead to 2026, platforms from Instagram to LinkedIn are doubling down on video views to measure attention. But views alone don't tell the whole story. For real insight, you must pair them with view duration and completion rates. I've seen content that holds viewers for 75% of its length triple its engagement—a clear sign of MoFu success. You can find more detailed insights on social media metrics to dig deeper on this.
This is it. The money-maker. Your bottom-of-funnel content is designed to do one thing: convert interested prospects into clients. This is your case studies, detailed service pages, sales webinars, and consultation offers.
At this stage, there’s no ambiguity. Your metrics have to be tied directly to conversions and revenue. Either your content is driving business, or it's not.
The BoFu metrics that matter:
To help you visualize all this, I've put together a table that maps everything out.
This table breaks down the primary goals, content types, and KPIs you should be tracking for your personal brand at each stage of the funnel.
By matching your metrics to the funnel stage, you stop guessing and start getting a clear, nuanced picture of what’s working. Every piece of content gets a clear job and a measurable impact on your business.
Let's be real. Measuring content performance isn't magic. It's about having the right setup to track what’s actually working. Without it, you're just guessing—and guessing is a terrible way to build a brand.
You need to move from hoping your content works to knowing which pieces drive real business results. This is where you build the technical foundation.
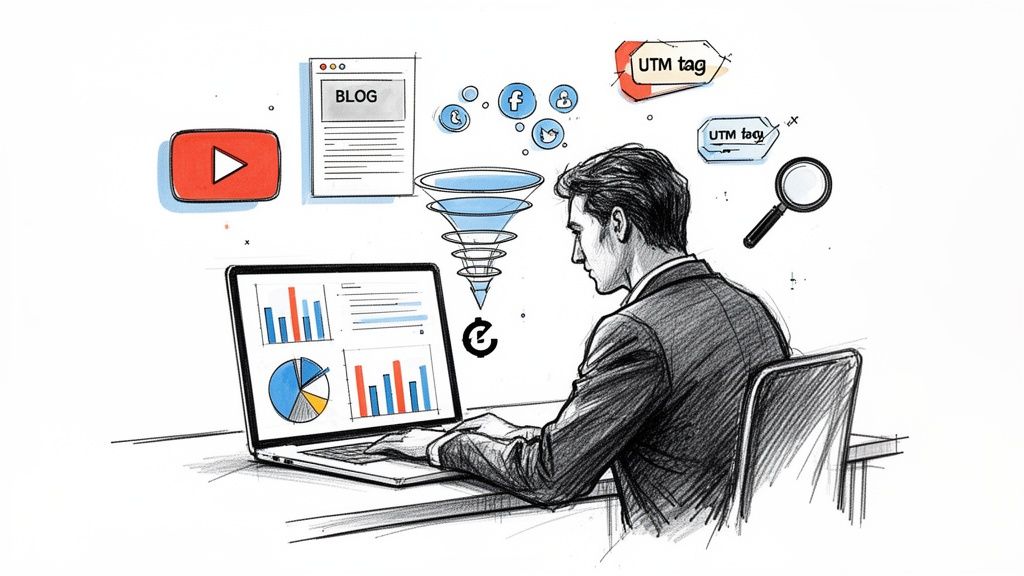
Think of it as the difference between a leaky bucket and a finely tuned pipeline. One wastes effort, the other delivers exactly what you need. For us, that means getting serious about UTM parameters and event tracking. These are non-negotiable if you want to see the full picture.
UTM parameters are simple tags you tack onto the end of a URL. They don't change the page a person lands on, but they feed crucial information back to your analytics, like Google Analytics.
This is how you stop lumping all your traffic together and start seeing what's really driving clicks. Was it that post on LinkedIn? Your email signature? That guest spot on a podcast? UTMs tell you.
A good UTM-tagged link always answers three questions:
utm_source): The specific platform. (e.g., linkedin, podcast-guest-feature)utm_medium): The marketing channel. (e.g., social, referral, email)utm_campaign): The "why" behind the link. (e.g., q3-webinar, personal-brand-launch)Let's say you're a consultant who just did an interview on a popular industry podcast. Instead of just telling people to visit yourwebsite.com, you give them a specific link: yourwebsite.com?utm_source=industry-podcast&utm_medium=referral&utm_campaign=guest-interview.
Boom. Now you can log into your analytics and see every single visitor, lead, and sale that came directly from that one podcast appearance. It turns a fuzzy "brand awareness" activity into something with a measurable ROI.
UTMs tell you where people came from. Event tracking tells you what they do once they get to your site. With Google Analytics 4 (GA4), you can track almost any interaction as an "event," letting you measure the actions that actually grow your business.
This is how you connect content to cash.
You don't just want to know if someone read your article. You want to know if that article got them to book a call. Event tracking connects those dots.
Here are a few critical events I always tell my clients to set up:
Setting these up in GA4 is easier than you think, and you can often do it right in the dashboard without touching a line of code. Gathering raw data is also a key part of the process, and using a guide to extract YouTube comments for analysis can provide incredible insights into audience sentiment.
When you put it all together, you get a crystal-clear view. You'll know that your podcast feature didn't just send 500 visitors—it generated 15 qualified leads. That’s the kind of data that lets you make smart decisions and pour fuel on what's working.
And as you're getting your toolkit in order, check out our roundup of the 12 best tools for content creators in 2026 to build your brand.
Let's be honest—all the data in the world is useless if it’s spread across a dozen different platforms. Your analytics are only valuable if they tell a clear story you can actually act on. This is why you need a content performance dashboard. It’s your single source of truth.
The goal isn't to build complicated charts that look impressive but tell you nothing. It’s about creating one central place to see the KPIs that truly matter for your personal brand. A good dashboard helps you make faster, smarter decisions about where to put your time and energy.
You don’t need some crazy expensive, complex business intelligence platform to get started. The best tool is the one you’ll actually open up and use consistently.
My advice? Start with a simple Google Sheet. Nail down the exact KPIs you need to track. Once you have that clarity, you can graduate to an automated tool like Looker Studio and save yourself a ton of time.
A big corporate dashboard might track dozens of metrics, but for a personal brand, less is more. Your dashboard should be a quick-glance summary of your brand's health, not a data-dump that gives you a headache.
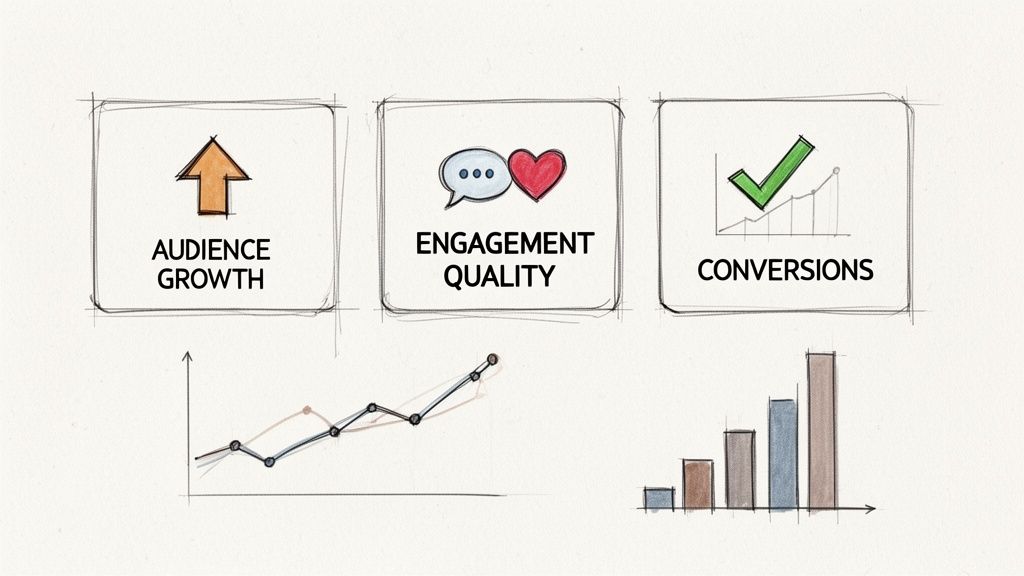
I tell my clients to structure their dashboards around three core pillars. These directly show you how healthy your personal brand is: Audience Growth, Engagement Quality, and Conversion Impact.
1. Audience Growth
This section answers one simple question: "Is my influence expanding?"
2. Engagement Quality
This tells you: "Are people actually listening and connecting with my message?"
You also have to understand what's "good" on each platform. For instance, recent reports show that in 2026, TikTok's engagement rate is projected to hit a massive 3.70%, which is a 49% jump year-over-year. For comparison, Instagram sits at 0.48% and Facebook is just 0.15%. Knowing this helps you set realistic goals. You can discover more insights in the 2026 social media benchmarks report.
3. Conversion Impact
This is the bottom line. It answers: "Is my content actually driving business results?"
Your dashboard should be a story, not a spreadsheet. Start with your highest-level business goals at the top (Conversions), then show the metrics that get you there (Engagement and Audience). This structure keeps you focused on what truly matters.
When you organize your dashboard this way, you create a powerful narrative. You can instantly see how growing your audience leads to better engagement, which in turn drives the conversions that build your business.
So, you’ve got your dashboards set up. That’s the easy part.
The real work starts now. Collecting data is just step one; the main event is turning those numbers into decisions that actually grow your brand. This is where you figure out the "so what?" behind every metric and start the cycle of testing and improving.
This is what separates the personal brands that stall out from the ones that build real influence and drive revenue. It’s all about creating a rhythm for looking at your numbers, asking the right questions, and then actually doing something about what you find.
First things first, you need a schedule. If you don't put it on the calendar, "I'll get to it later" becomes "never." The right rhythm depends on how fast the platform moves and what you're tracking.
Here’s a simple breakdown:
This simple structure keeps you from overreacting to one bad day but ensures you don’t miss a major shift in what your audience wants.
The point isn't just to stare at charts. It's to build a discipline of analysis. A consistent cadence turns measurement from a chore into your biggest strategic advantage.
Your dashboard will show you what happened—which posts crushed it and which ones flopped. Your job is to figure out why.
You have to get curious. Put on your detective hat.
When you see a top-performing post, don't just pat yourself on the back. Dissect it. Ask yourself:
The same goes for the duds. A LinkedIn post got tons of views but zero leads? Maybe the message was too generic and didn't speak to your ideal client. Blog traffic is up but no one is signing up for your list? Your on-page CTAs are probably weak or nonexistent.
I have a consultant client who noticed one of her blog posts was driving 40% of her monthly leads. We dug in and realized it wasn't just the topic. It was the two case study snippets and a direct "Apply for a Strategy Session" CTA she had placed right in the middle of the article.
So what did we do? We applied that exact structure to her other popular posts. The result? A 25% lift in overall leads the very next month.
All this analysis naturally leads to a content audit. This is just a systematic way of looking at everything you’ve created and deciding what to do with it. Not every post deserves to live forever.
Your choices are simple:
This constant loop of analysis, questioning, and action is the engine that drives a winning content strategy. It’s how you stop guessing and start giving your audience exactly what they need to see you as the go-to expert.
I get asked these questions all the time. Everyone wants to know if their content is actually working, but they get stuck in the weeds of analytics.
Let's clear a few things up.
It’s tempting to refresh your stats every five minutes. Don't.
For things that move fast, like social media, a quick weekly glance at your engagement and reach is all you need.
But for the big picture stuff—website traffic, leads, and actual business impact—you need more time. A monthly or quarterly review is where you'll find the real story. Never, ever pivot your entire strategy because of one bad day. That’s just reactive noise.
This is the wrong question to ask. Chasing some universal benchmark is a waste of time.
It's going to be different for every platform and every industry. For what it's worth, people see around 0.48% on Instagram, but that jumps to 3.70% on TikTok. See what I mean? It’s all over the place.
The only number that matters is your own. Your goal isn't to beat a random average; it's to beat your performance from last month. Focus on steady, consistent improvement.
You don't measure top-of-funnel content with a direct sales number. It's about tracking the signals that show you're moving in the right direction. Look for things like more newsletter sign-ups, an increase in people searching for your name, or getting shout-outs from other leaders in your space. These are the real signs your brand equity is growing.
Ready to stop guessing and start building a personal brand that drives real business results?
At Legacy Builder, we transform your expertise into a powerful content engine that brings in leads and opportunities.
Book your discovery call today and let's talk about building your legacy.


You could – but most in-house teams struggle with the nuance of growing on specific platforms.
We partner with in-house teams all the time to help them grow on X, LI, and Email.
Consider us the special forces unit you call in to get the job done without anyone knowing (for a fraction of what you would pay).
Short answer – yes.
Long answer – yes because of our process.
We start with an in-depth interview that gives us the opportunity to learn more about you, your stories, and your vision.
We take that and craft your content then we ship it to you. You are then able to give us the final sign-off (and any adjustments to nail it 100%) before we schedule for posting.
No problem.
We have helped clients for years or for just a season.
All the content we create is yours and yours alone.
If you want to take it over or work on transitioning we will help ensure you are set up for success.
We want this to be a living breathing brand. We will give you best practices for posting and make sure you are set up to win – so post away.
Subscribe to our newsletter and get insights on how to grow your personal brand.