.svg)
Subscribe to our newsletter and get insights on how to grow your personal brand.
Thank you! Your submission has been received!
Oops! Something went wrong while submitting the form.
.svg)



Most advice about audience engagement metrics starts with the wrong premise: higher engagement always means better content. It doesn't. A post can collect likes from people who'll never buy, while a quieter post generates a thoughtful reply, a profile visit, or a direct message from the exact person you want in a sales conversation.
I've seen founders celebrate screenshots full of reactions while their pipeline stays empty. I've also seen posts with modest reach create meaningful commercial momentum because the interactions carried intent. Engagement isn't a trophy. It's a portfolio of signals, and each signal deserves a different weight depending on the platform, audience, and business goal.
The practical question is simple: which audience behaviors predict a measurable next step toward revenue? Everything else belongs in the “interesting, but not decisive” column.
The most common engagement rate adds interactions together and divides them by reach, impressions, or followers. That calculation can be useful, but it becomes misleading when teams treat every interaction as equally valuable. A like, a save, a share, and a sales-oriented DM are not interchangeable events.
A high like count often tells you that a post was easy to consume or socially acceptable. It doesn't necessarily tell you that the reader trusted your expertise, remembered your argument, or wants to hire you. Shares and saves require more active behavior, while replies and DMs can expose a specific problem, buying question, or objection.
My rule: If a metric can't help you decide what to publish, amplify, rewrite, or stop, it's probably a reporting decoration.
Impression-based engagement rate rewards content that earns interaction relative to delivery. Reach-based engagement rate focuses on response among people who saw the post. Follower-based engagement rate helps track the health of an established audience. Each answers a different question, so comparing them as though they're the same measure produces bad decisions.
Platform comparisons create another trap. A 2026 cross-platform benchmark reported follower-based engagement around 2.70% for TikTok, 0.45% for Instagram, 0.13% for Facebook, and 0.10% for X, based on a study of 70 million posts. Those figures are useful only when you preserve the platform context and denominator, as explained in independent engagement benchmarking guidance.
TikTok's stronger benchmark performance doesn't mean every TikTok interaction has more business value than every LinkedIn interaction. It means the audiences, formats, distribution systems, and reporting conventions differ.
Founders also benchmark themselves against creators with enormous, entertainment-led audiences. That audience may be trained to react quickly, while a B2B audience may engage through a private question, a saved framework, or a referral to a colleague.
Judge a post against its role in your funnel, not against a celebrity's screenshot. A post with fewer likes can be more successful if it generates qualified conversations, email subscribers, or attributed opportunities.
Before building a dashboard, define the events you're counting. Raw interactions should remain atomic, meaning you preserve likes, comments, shares, saves, clicks, impressions, reach, and replies as separate fields rather than burying them in one total. This approach follows the measurement principle that platform-specific semantics matter because a TikTok completion, LinkedIn repost, and Instagram save represent different behaviors (measurement guidance for social engagement).
The platform exposes these events differently. Instagram may report saves, comments, shares, and profile actions. LinkedIn often emphasizes total engagements, comments, reposts, and clicks. TikTok commonly centers engagement relative to reach. YouTube adds viewing behaviors that don't map cleanly to a social save.
| Event | Platforms Reporting It | What High Values Suggest | What Low Values Suggest |
|---|---|---|---|
| Likes or reactions | TikTok, Instagram, Facebook, LinkedIn, X, YouTube | The idea is easy to endorse or recognize | The opening or topic may lack immediate appeal |
| Comments | TikTok, Instagram, Facebook, LinkedIn, X, YouTube | The content provokes thought, disagreement, or questions | The message may feel passive or complete without discussion |
| Shares or reposts | TikTok, Instagram, Facebook, LinkedIn, X, YouTube | The audience sees distribution value or social relevance | The idea may not feel useful to another person |
| Saves or bookmarks | TikTok, Instagram, Facebook, YouTube | The content has reference or learning value | The post may be disposable or insufficiently practical |
| Clicks or link taps | Most major platforms | The content creates enough intent to continue | The promise, CTA, or audience fit may be weak |
| Replies or DMs | Most platforms with messaging | The audience wants dialogue, clarification, or help | The post may not invite a personal response |
Don't collapse these fields until after you've preserved their original meaning. A LinkedIn comment can be a detailed trust signal, while a short-form video comment may be a rapid reaction. The label is identical, but the behavior isn't.
The standard formulas are straightforward. The difficult part is choosing the denominator that matches the decision you're making, then keeping it stable.
Use total engagements as the numerator, but define that total before reporting. A practical model can include likes, comments, shares or reposts, saves, clicks, and replies or DMs. If a platform reports a meaningful native event that doesn't appear elsewhere, preserve it separately instead of forcing it into an invented equivalence.
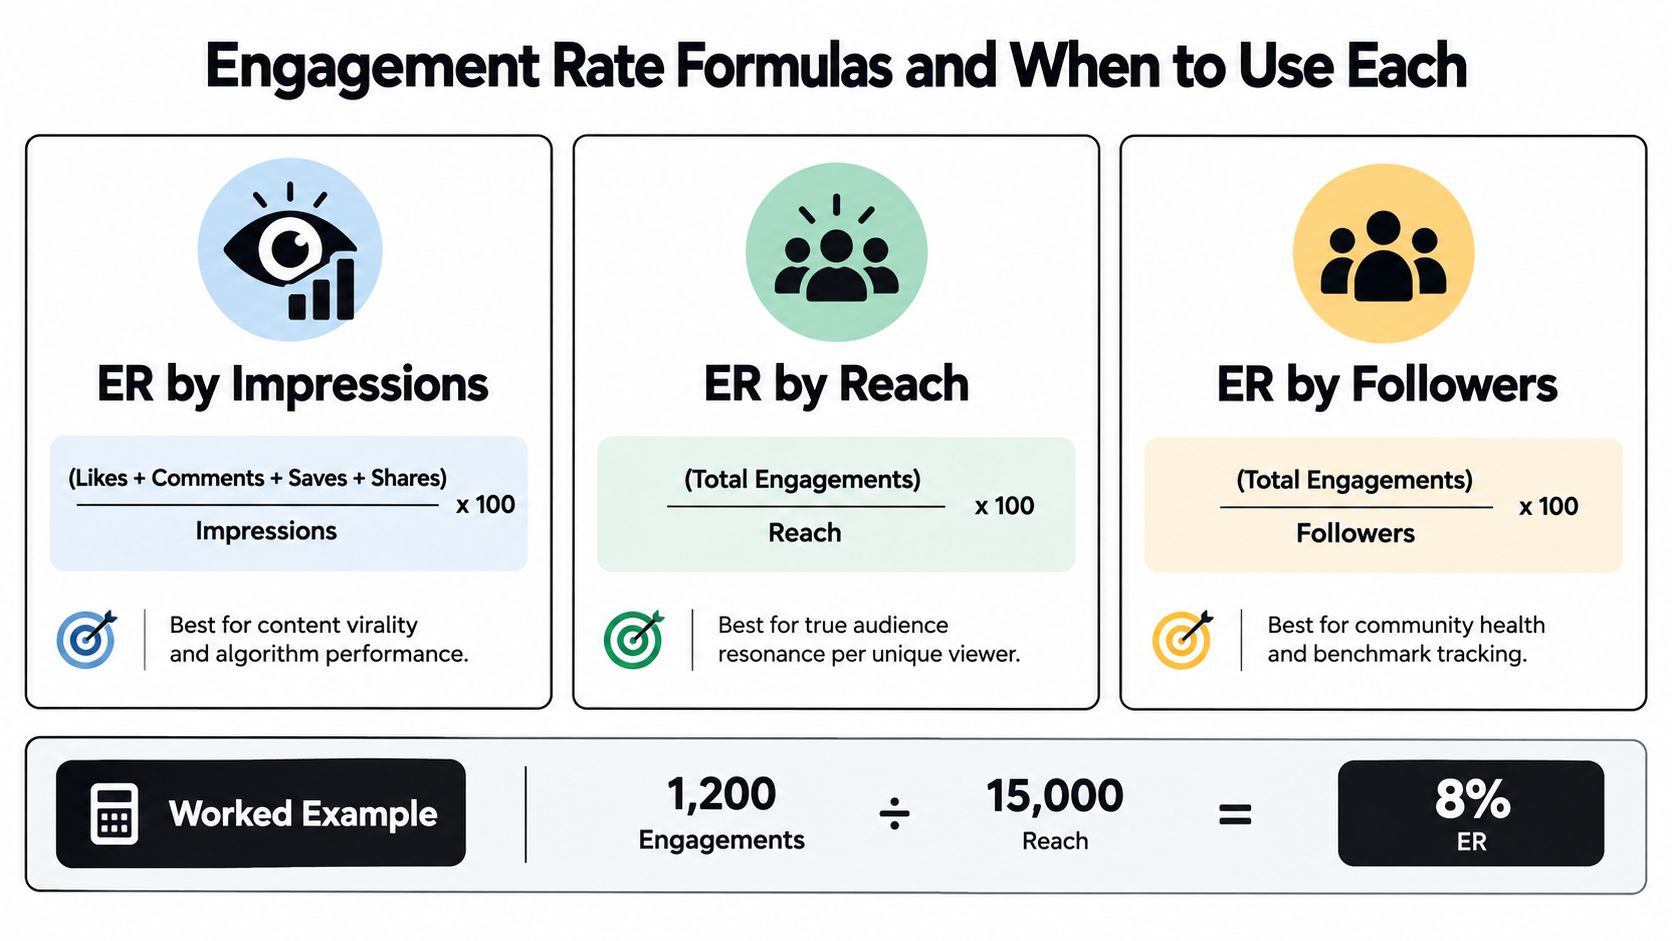
ER by impressions equals total engagements divided by impressions, multiplied by 100. Use it to evaluate how strongly the creative performs against total delivery. It's useful for comparing posts that received different amounts of distribution.
ER by reach equals total engagements divided by reach, multiplied by 100. Use it to understand response among unique viewers. This is often the clearest lens for message resonance once the platform has delivered the content.
ER by followers equals total engagements divided by followers, multiplied by 100. Use it for audience-base health and account-level benchmarking. It doesn't tell you that every follower saw the post, so don't use it to judge delivery efficiency.
Consider one hypothetical post with 50 reactions, 12 comments, 8 shares, and 5 saves. Its total engagements are 75. With 1,000 impressions, ER by impressions is 7.5%. With 800 reach, ER by reach is 9.375%. With 4,000 followers, ER by followers is 1.875%.
Those calculations use a hypothetical example, not a performance benchmark. For additional engagement rate examples and tips, focus on whether the chosen denominator fits the question you're trying to answer.
Denominator discipline: Pick one primary formula per platform, document it beside the metric, and never mix denominators inside the same trend line.
There is no universal engagement-rate target that applies across TikTok, Instagram, Facebook, LinkedIn, X, and YouTube. Benchmarks shift with audience composition, format, distribution, account size, and denominator choice. A benchmark is useful as a diagnostic reference, not as a verdict on content quality.
The available benchmark data also shows why context matters. One 2026 report identified TikTok at a 2.60% average engagement by followers, compared with 0.15% for Facebook, while another benchmark reported TikTok at 2.70%, Instagram at 0.45%, Facebook at 0.13%, and X at 0.10%. The reports use different datasets and measurement contexts, so don't blend them into one universal score. Review the 2026 social media benchmark report alongside the platform-specific methodology.
The requested follower-tier ranges below aren't included in the verified data, so I won't fabricate them. Instead, use the table as a benchmarking protocol. Populate each cell with the median, upper-quartile, and outlier values from one consistent report, using the same denominator and date range.
| Platform | Under 10K followers | 10K-100K followers | 100K+ followers | Notes |
|---|---|---|---|---|
| TikTok | Use a follower-based benchmark from one report | Use the same report and formula | Use the same report and formula | Reach-based and follower-based figures aren't interchangeable |
| Instagram Reels and feed posts | Separate Reels from feed posts | Keep format labels intact | Compare like with like | Saves and shares can carry more intent than likes |
| Use a Facebook-specific baseline | Preserve the denominator | Avoid comparing directly with TikTok | Benchmark performance is materially lower in the cited cross-platform data | |
| Use account-size and format-matched data | Separate personal profiles from pages | Compare with similar audience types | Total engagement reporting can differ from rate reporting | |
| X | Use an X-specific baseline | Keep replies, reposts, and likes separate | Avoid universal targets | Low rates can still accompany high-value conversations |
| YouTube | Separate Shorts from long-form video | Preserve view and interaction definitions | Compare within format | Views and engagement shouldn't be treated as identical signals |
The practical takeaway is blunt: don't chase cross-platform parity. A founder should compare LinkedIn posts against LinkedIn posts, TikTok videos against TikTok videos, and conversion-oriented content against other conversion-oriented content.
A single engagement rate hides the decision you need to make. Two posts can report the same rate while one earns passive likes and the other produces saves, shares, profile visits, and replies from prospective buyers.
Start with format. Carousels and short-form video often give audiences more reasons to save or share, while a single-image post may generate faster reactions. That isn't a rule to copy blindly. Tag each post by format, then inspect which events it produces.
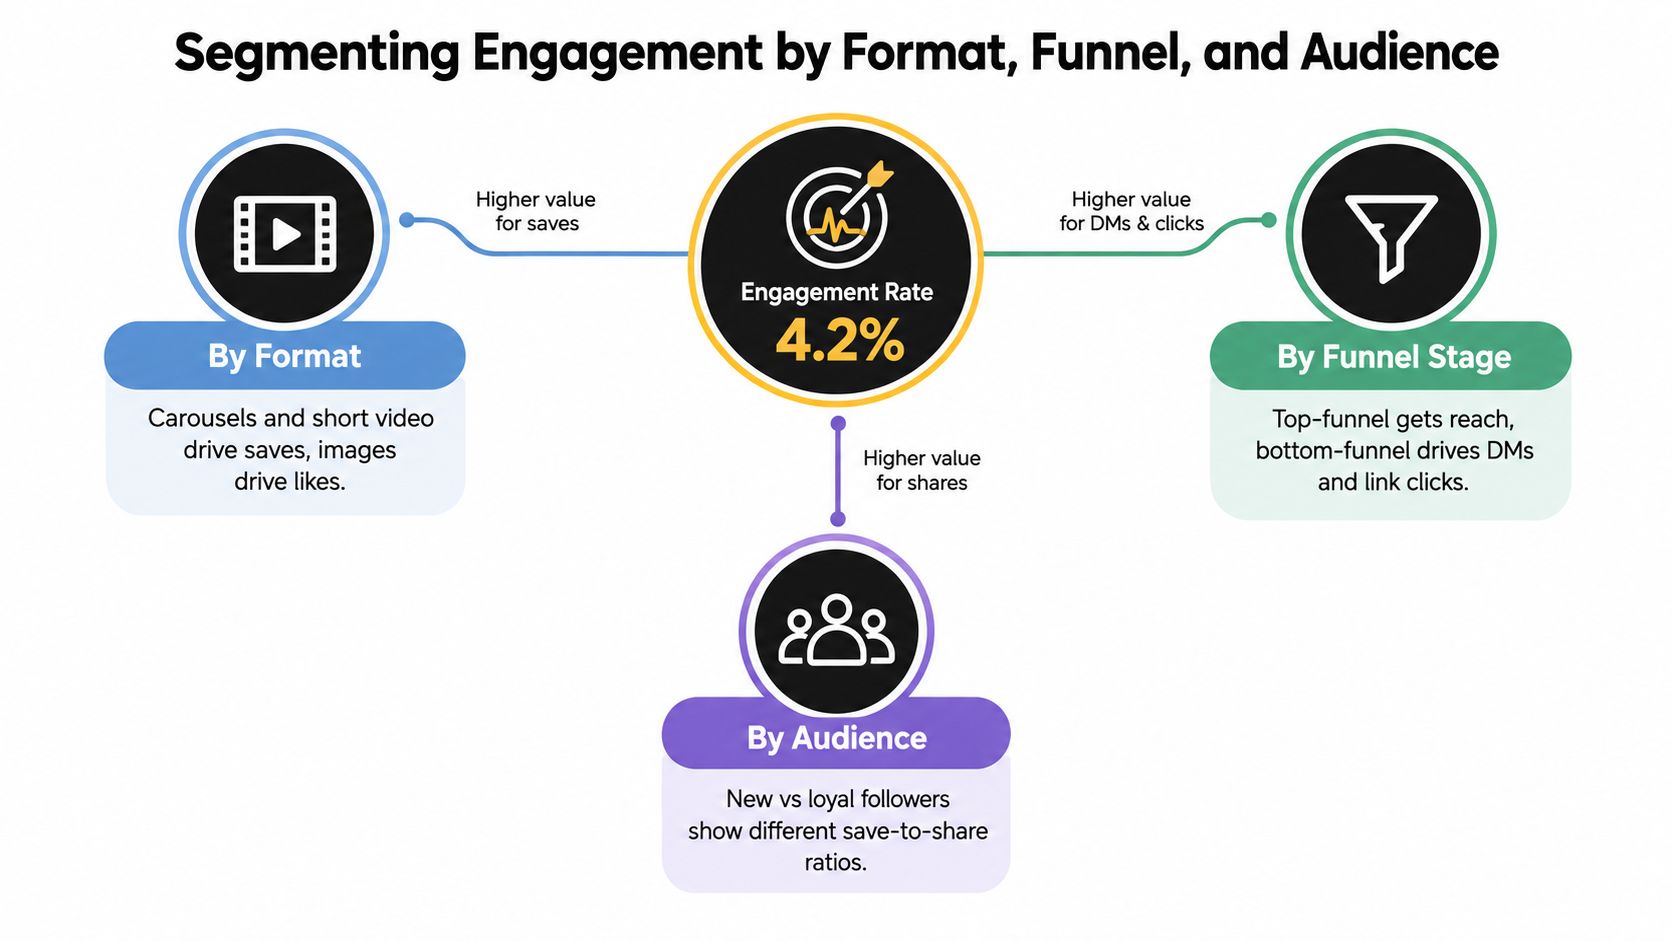
Funnel stage changes the metric you should prioritize:
Audience segment adds another layer. Compare new followers with long-term followers, organic followers with campaign-acquired followers, and relevant customer groups with everyone else. A broad audience may produce more reactions, while a smaller high-fit segment may produce sharper questions.
A founder with a 4.2% engagement rate might initially consider the account healthy. After format tagging, the founder may discover that carousels generate 70% of saves. That doesn't prove carousels cause pipeline, but it gives the team a rational next test: produce more educational carousels, track the resulting saves and conversations, and connect those actions to downstream outcomes.
For a deeper treatment of audience cohorts, review this CX team audience segmentation guide and the personal brand audience segmentation guide. Use segmentation to make decisions, not to create another ornate dashboard.
Raw engagement rate treats a like and a DM as though they carry equal meaning. That's the core flaw. If your business depends on trust, expertise, and conversations, you need a score that gives more influence to behaviors closer to a commercial next step.
Use this starting model:
These are operating weights, not verified universal coefficients. Calibrate them against your own outcomes. A consultant may assign more weight to qualified DMs, while a course creator may care more about saves and link clicks.
A simple formula is:
Weighted score = (likes × 0.5) + (comments × 1.5) + (shares × 2) + (clicks × 2) + (saves × 3) + (replies or DMs × 3)
Divide that score by reach when you want to compare posts delivered to different audience sizes. Keep the unweighted totals visible beside it so you can see whether a score rose because of broad activity or high-intent actions.
Post A may earn many likes and few saves. Post B may earn fewer total interactions but several DMs and shares. Their raw rates can look similar, yet Post B deserves closer review because it produced behaviors nearer to a sales conversation.
Pipeline test: A weighted score is useful only if it improves your next decision and eventually correlates with qualified actions in your CRM.
Track the score by content goal. Saves support educational authority, shares support network-driven discovery, and DMs support sales readiness. For a broader approach to evaluating marketing outcomes, compare this framework with marketing ROI measurement guidance.
Founders don't need another dashboard. They need a reporting rhythm they'll still use after the novelty disappears. Match each review to one decision type and produce one practical artifact.
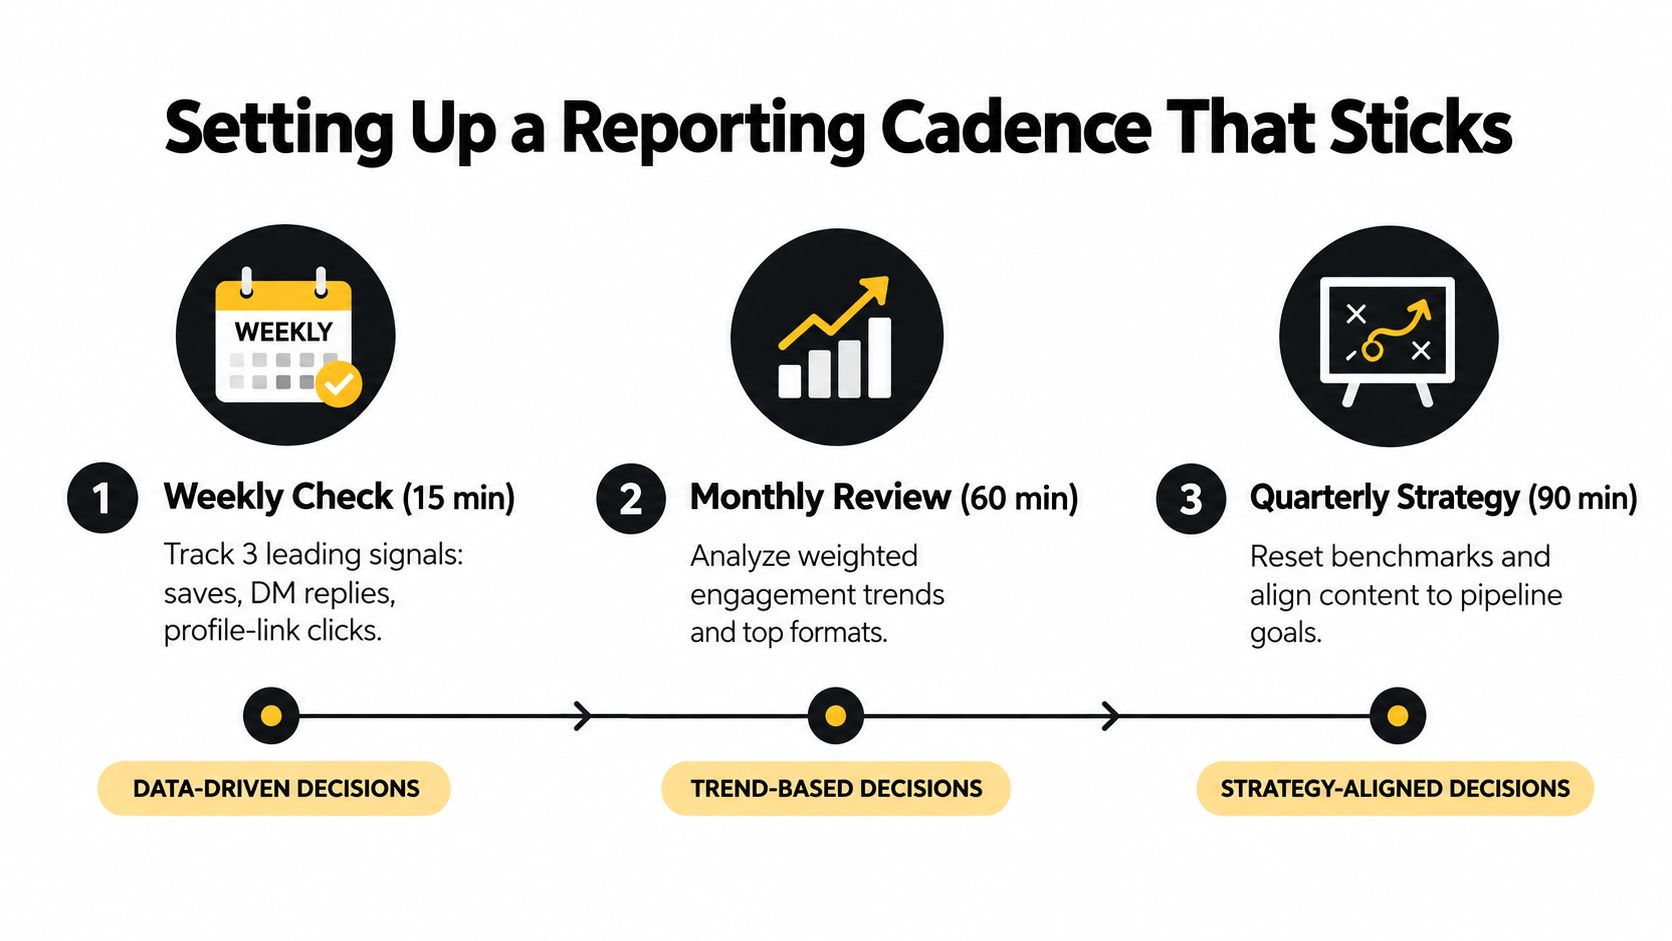
Weekly review, 15 minutes: Check saves, DM replies, and profile-link clicks. Record the top posts, the dominant content goal, and one audience phrase worth reusing. The output is a one-page scorecard, not a new analytics project.
Monthly review, 60 minutes: Compare weighted engagement by format and funnel stage. Identify which formats earn high-intent events, which topics attract the right audience, and which posts create attention without movement. The output is a format-versus-goal matrix.
Quarterly review, 90 minutes: Compare engagement trends with attributed pipeline, list growth, and qualified conversations. Review whether your weights still reflect business value. The output is a benchmark-versus-actual summary with clear decisions for the next quarter.
Keep the fields stable: post ID, platform, date, format, funnel stage, audience segment, impressions, reach, followers, each atomic event, weighted score, clicks, leads, and pipeline status. If a field doesn't support a decision, remove it.
The content performance guide for personal brands can help frame the broader reporting process. Your system should be less impressive than a corporate dashboard and much more likely to survive founder attention decay.
A single post is an observation, not a trend. To interpret movement, plot a 30-day trailing weighted engagement line, then annotate the variables that changed during that period. Record posting-time changes, new content series, audience growth bursts, paid distribution, and known platform shifts.
Next, separate the signal from the confounders. If reach rose because a platform distributed one post unusually widely, that doesn't prove your content suddenly became more relevant. If saves and meaningful replies rise across several formats, the evidence for stronger audience fit is more persuasive.
Use three categories:
Watch the quality of comments, not only their quantity. A rise in emoji-only comments alongside flat DMs may indicate shallow interaction. Rising impressions with no increase in profile actions or clicks can mean distribution improved without commercial relevance.
| Trend Pattern | Likely Cause | Recommended Response |
|---|---|---|
| Weighted score rises across several formats | Stronger topic or audience fit | Repeat the underlying problem, not just the surface format |
| Impressions rise while DMs stay flat | Broader distribution without stronger intent | Tighten audience relevance and conversion prompts |
| Saves fall before comments decline | Educational usefulness may be weakening | Improve specificity, examples, and reference value |
| Comments become shorter and less specific | Lower discussion depth or weaker trust | Ask sharper questions and address concrete problems |
| One post produces an extreme spike | Temporary distribution or unusual topic fit | Isolate the variable before changing the whole strategy |
Industry coverage has documented how engagement can move sharply across periods and platforms, including TikTok median engagement easing from 35.9% in Q3 2025 to 27.6% in Q4 2025, while still ranking highest among major platforms in that benchmark. Treat such movement as context, not proof that your own audience relationship changed (industry benchmark coverage).
A personal brand usually needs three layers, not an expensive maze of tools. Native analytics provide the authoritative view of each platform's own impressions, reach, interactions, and audience behavior. Their weakness is cross-platform comparison and custom weighting.
Third-party dashboards such as Metricool, Buffer Analytics, and Iconosquare can simplify historical reporting, scheduling context, tagging, and rollups. They also introduce subscription costs, platform API limitations, and normalization choices you need to understand before trusting a combined score.
A spreadsheet remains useful because it gives you control. Export platform data, preserve raw events, add format and funnel tags, calculate weighted scores, and connect posts to CRM outcomes. A spreadsheet won't solve bad definitions, but it makes those definitions visible.
| Layer | Strengths | Weaknesses | Best For |
|---|---|---|---|
| Native platform insights | Direct platform data, strong reach and impression detail | Limited cross-platform normalization | Every founder, especially early-stage accounts |
| Third-party dashboard | Historical views, tagging, scheduling context, cross-platform rollups | Paid access, API gaps, normalization risk | Brands managing multiple platforms consistently |
| Spreadsheet roll-up | Flexible weights, custom segmentation, export portability | Manual upkeep and data-cleaning work | Founders who need business-specific reporting |
| CRM connection | Links clicks, forms, DMs, and leads to pipeline | Requires consistent tagging and attribution | Brands making revenue decisions |
For an early-stage founder, native insights plus one spreadsheet are enough. A mid-stage personal brand may benefit from one paid dashboard, while a larger operation usually still needs a tagged spreadsheet or warehouse for custom scoring. Legacy Builder is one option for founders who want support with content strategy, creation, distribution, and audience interaction rather than building the operating system alone.
Choose tools using five tests: data freshness, cross-platform normalization, tagging flexibility, cost per seat, and export portability. If a vendor fails the export test, treat that as a strategic risk.
Run this routine on Monday before you schedule the week. Give it enough time to make decisions, but don't turn it into a reporting ceremony.
Use clear rules, but don't pretend universal thresholds exist where the verified data doesn't provide them. For example, a share-heavy post may deserve repurposing, while a post with strong reach and weak DMs may need a more specific commercial bridge.
The checklist's purpose is action. If you finish Monday with more columns but no publishing decision, the system failed.
Engagement metrics are proxies for audience movement. They matter because they can show whether viewers are becoming repeat readers, subscribers, advocates, or prospective buyers. They don't matter because a platform awarded your post a flattering number.
Track three outcomes alongside engagement:
Platform analytics rarely capture the full downstream journey. A person may save a post, return later, click your profile, join your email list, and eventually start a sales conversation without the original post receiving credit. A UTM-tagged link in your bio, campaign-specific links, and consistent CRM source fields close part of that attribution gap.
The weekly diagnostic question is:
Did this week's engagement produce a measurable step toward revenue, or only noise?
Use the answer to change your content decisions. If saves rise but no one joins your list, improve the bridge from education to ownership. If DMs increase but qualified opportunities don't, improve your offer, qualification, or response process. If likes rise while every commercial signal stays flat, stop celebrating the likes.
Audience engagement metrics are navigation instruments. They help you choose the next turn, but they aren't the destination.
Legacy Builder helps founders turn personal stories, expertise, and business goals into consistent content, distribution, and audience engagement reporting. Visit Legacy Builder to explore a more structured way to connect content signals with personal-brand growth and pipeline decisions.


You could – but most in-house teams struggle with the nuance of growing on specific platforms.
We partner with in-house teams all the time to help them grow on X, LI, and Email.
Consider us the special forces unit you call in to get the job done without anyone knowing (for a fraction of what you would pay).
Short answer – yes.
Long answer – yes because of our process.
We start with an in-depth interview that gives us the opportunity to learn more about you, your stories, and your vision.
We take that and craft your content then we ship it to you. You are then able to give us the final sign-off (and any adjustments to nail it 100%) before we schedule for posting.
No problem.
We have helped clients for years or for just a season.
All the content we create is yours and yours alone.
If you want to take it over or work on transitioning we will help ensure you are set up for success.
We want this to be a living breathing brand. We will give you best practices for posting and make sure you are set up to win – so post away.
Subscribe to our newsletter and get insights on how to grow your personal brand.
