.svg)
Subscribe to our newsletter and get insights on how to grow your personal brand.
Thank you! Your submission has been received!
Oops! Something went wrong while submitting the form.
.svg)



Most marketing ROI advice is too comfortable. It gives you a neat percentage from revenue minus cost, then acts like the job is done. That number can be useful, but on its own it's often a polished lie, because it ignores organic baseline sales, leaves out real costs, and credits the wrong time window.
If you've ever watched a campaign look profitable in a dashboard while cash bled out of the business, you already know the problem. How to calculate marketing ROI is not a math trick, it's a measurement system, and the system only works when you decide what counts, what gets credited, and what creates margin.

The standard formula is familiar for a reason. The baseline version is (revenue generated − marketing cost) ÷ marketing cost × 100, and a campaign with $15,000 in attributable revenue on $5,000 of spend works out to 200% ROI because (15,000 − 5,000) ÷ 5,000 × 100 = 200, as described in the standard marketing ROI formula from Investopedia's marketing ROI guide. That formula is fine as a starting point. It is not fine as a verdict.
The first lie is baseline revenue. Some sales would have happened anyway, especially if the campaign is attached to a brand that already has demand. If you don't subtract the organic baseline, you're claiming credit for money marketing didn't create.
The second lie is undercounted cost. Teams love to log media spend and forget the rest, especially labor, creative, tools, and contractor fees. That makes weak campaigns look decent because the denominator is too small.
The third lie is the time window. A short window flatters fast channels and punishes slow ones. If your sales cycle is longer than the reporting period, the ROI number isn't wrong by a little, it's wrong by design.
Practical rule: before you trust a ROI percentage, ask three questions, what revenue was already going to happen, what costs were actually loaded into the campaign, and what time window got credit.
A useful way to sanity-check the math is to calculate it two ways. Top down, you start with revenue. Bottom up, you estimate from leads and conversion behavior. HubSpot's framework shows the bottom-up version clearly, using inputs like lead-to-customer rate and average sale price, and noting that if 12 out of 100 leads become customers, the rate is 12% or 0.12 in the formula HubSpot's content marketing ROI guide. Business.com's example of 20 conversions from 500 interactions equal to 4% is the same kind of operational math, just applied to conversion rate.
Here's the clean version a founder can use tonight:
Or build it from the bottom up:
If a campaign drove 50 leads, closed 12% of them, and the average sale was $500, the attributable revenue estimate is 50 × 0.12 × 500 = $3,000. If the campaign cost $1,000, the ROI is (3,000 − 1,000) ÷ 1,000 × 100 = 200%. That's the same structure as the top-down formula, just built from the operational inputs that marketers control.
For a deeper comparison between traditional and digital measurement habits, the breakdown in this quick guide to ROI across traditional and digital marketing is a useful companion. It helps frame why channel selection changes what you can credibly measure.
The honest takeaway is simple. A ROI number is decision-grade only when you can defend the revenue, the cost base, and the attribution window. If you can't do that, the percentage is theater.
Start with media spend because it's the easiest line item to find. That's sloppy. A real denominator includes everything required to launch, run, and support the campaign, not just the ad invoice.
The cleanest approach is to build a fully loaded cost sheet. Track creative production, tools and software, agency or contractor fees, internal labor hours, and a reasonable slice of overhead. If your team spent time briefing a designer, editing a landing page, setting up tracking, or managing revisions, that time belongs in the cost base.
A simple spreadsheet can keep this honest:
The point isn't accounting perfection, it's decision accuracy. If you omit labor, the campaign looks cheaper than it really was. If you omit software, the channel can look more efficient than a true apples-to-apples comparison. If you omit contractor fees, the ROI number flatters outsourced execution and punishes in-house execution for no good reason.
Cost rule: use the cost base you'd need to repeat the campaign responsibly, not the cost base that makes the slide look good.
When you capture costs this way, you stop comparing fantasy spend to real revenue. That matters because gross spend is usually the wrong denominator for a channel-level decision. A campaign that looks strong on media-only costs can fall apart once you load the full operating cost into the math.
If you want a quick template, build one row per cost category and one column for notes. The note column should explain whether the cost is one-time or recurring, because that changes how you interpret future campaigns. A one-time edit system purchase shouldn't be treated the same way as ongoing labor.
The discipline here is blunt. If a line item helped create the result, it belongs in the denominator. If you leave it out, you're not measuring ROI, you're measuring spend that happened to be easy to track.
Revenue-based ROI is convenient, and convenience is why so many teams use it. It's also why they make bad budget calls. Revenue tells you what came in, not what stayed after product costs, discounts, and fulfillment pressure hit the business.
That's why the question isn't whether the formula works. It's whether revenue ROI or gross profit ROI matches the decision you're making. Salesforce, Oracle, Investopedia, and Neil Patel all present the familiar revenue-minus-cost approach in their ROI guidance, while other measurement guides point out that gross profit is the better lens when margins vary. The split matters most when you sell products with different markups, heavy discounting, or real fulfillment costs, as noted in Salesforce's marketing ROI guide.
Use revenue ROI when you're comparing campaigns with similar margin structure. Use gross profit ROI when product mix, discounting, or cost of goods sold changes the economics. Anything else is a cross-category comparison disguised as a clean dashboard.
A campaign can look healthy on revenue and weak on profit. That's not a nuance, that's the business. If you spend to acquire buyers whose orders barely clear costs, revenue-based ROI will cheer while the bank account disagrees.
A simple decision rule keeps this from getting fuzzy:
| Situation | Better Formula | Why |
|---|---|---|
| Similar offers and margins | Revenue ROI | The comparison is cleaner |
| Mixed products or heavy discounts | Gross profit ROI | Revenue can overstate true return |
| Channel review across a portfolio | Both side by side | Revenue shows volume, profit shows quality |
If you need a specific comparison, the same campaign can be perfectly acceptable on revenue and unattractive on gross profit once COGS and discounts are included. That's exactly why teams should never let a single formula run the whole budget conversation.
My rule: if margin changes the decision, revenue ROI is not enough. Put gross profit on the same dashboard or you're optimizing for the wrong thing.
The bottom line is blunt. Revenue ROI is a useful first pass. Gross profit ROI is the version that tells you whether the campaign contributed to the business.
Attribution is where marketing teams start fighting over credit, because the spreadsheet looks clean and the buyer journey is not. First-touch gives all the credit to the entry point. Last-touch gives all the credit to the final step before conversion. Multi-touch spreads credit across the journey, which is closer to how buyers behave.
That matters because buyers rarely move in a straight line. Demandbase's guidance on marketing ROI points to multi-touch attribution, CRM-based revenue stitching, and trailing windows as better fits for long-cycle buying, especially in B2B, where a prospect may touch many channels before purchase. Their framework also calls out pipeline ROI, incremental ROI, ROI per touchpoint, and LTV ROI as alternatives to a single campaign read, which is the right direction for measurement that reflects reality Demandbase's ROI marketing campaigns guide.
The window you choose changes the answer. A short window makes a campaign look strong when it catches quick buyers first. A longer window can show that the same campaign influenced more revenue, just later. ROI should be reviewed by channel and time period, not as one blended number that hides what happened.
Set the attribution window to match the sales cycle, then keep at least two views open, one short and one long. Leadership needs both if it wants to see whether the channel creates immediate demand or delayed demand.
Here's the trap. A campaign can look weak in a short window and solid in a longer trailing view. It can also look great early and then soften once refunds, churn, and delayed closes enter the picture. The number changes because the window changed, not because the channel suddenly improved or collapsed.
For teams comparing paid and organic work, use a source that separates ad efficiency from true investment return. The breakdown in a clear guide to ROAS formulas for ad-spend efficiency versus true investment return is useful when you need that distinction.
For a practical social-media lens, our guide on measuring social-media ROI for personal brands fits the same channel-by-channel mindset. It is the right way to evaluate content that assists conversions instead of closing them directly.
The serious takeaway is simple. Treat reported ROI as a range shaped by attribution and timing. If leadership insists on a single number, it is asking for false precision.
Content rarely pays on the first click. It compounds. A post that looks weak inside a short dashboard can be the thing that keeps producing leads long after the original publishing date, which is why content-driven personal brands need a different ROI lens.
The cleanest way to adjust is to replace one-time sale value with lifetime value, or LTV, when the content keeps driving future revenue. A basic LTV-adjusted formula uses LTV × new customers, then subtracts marketing investment and divides by that investment. That makes sense when the campaign creates a relationship, not just a transaction.
For a personal brand or creator-led business, that distinction is huge. A post that attracts one buyer who stays subscribed is more valuable than the same post viewed as a one-off sale. That's why short-window ROI often undervalues foundational content, especially when the buyer journey includes repeated touches before payment.
If you don't have cohorts yet, estimate LTV conservatively. Use your current average customer revenue over a reasonable period, then avoid fantasy multipliers. If you can't defend the estimate, keep it as a planning input rather than a board-level claim.
The question is when LTV-adjusted ROI should override a weak campaign-level read. The answer is when the content is clearly part of a repeatable acquisition system and the short window is obviously too narrow. That's especially true for evergreen articles, signature posts, and founder content that keeps surfacing in search, social, and direct referrals.
Content rule: if a piece of content keeps bringing in qualified leads after the publish date, judge it on lifetime value, not just the first month of revenue.
For a deeper look at lead quality inside that equation, how to measure lead quality to boost your ROI in 2026 is worth keeping nearby. Better leads make every ROI formula look smarter because they improve the conversion side of the math.
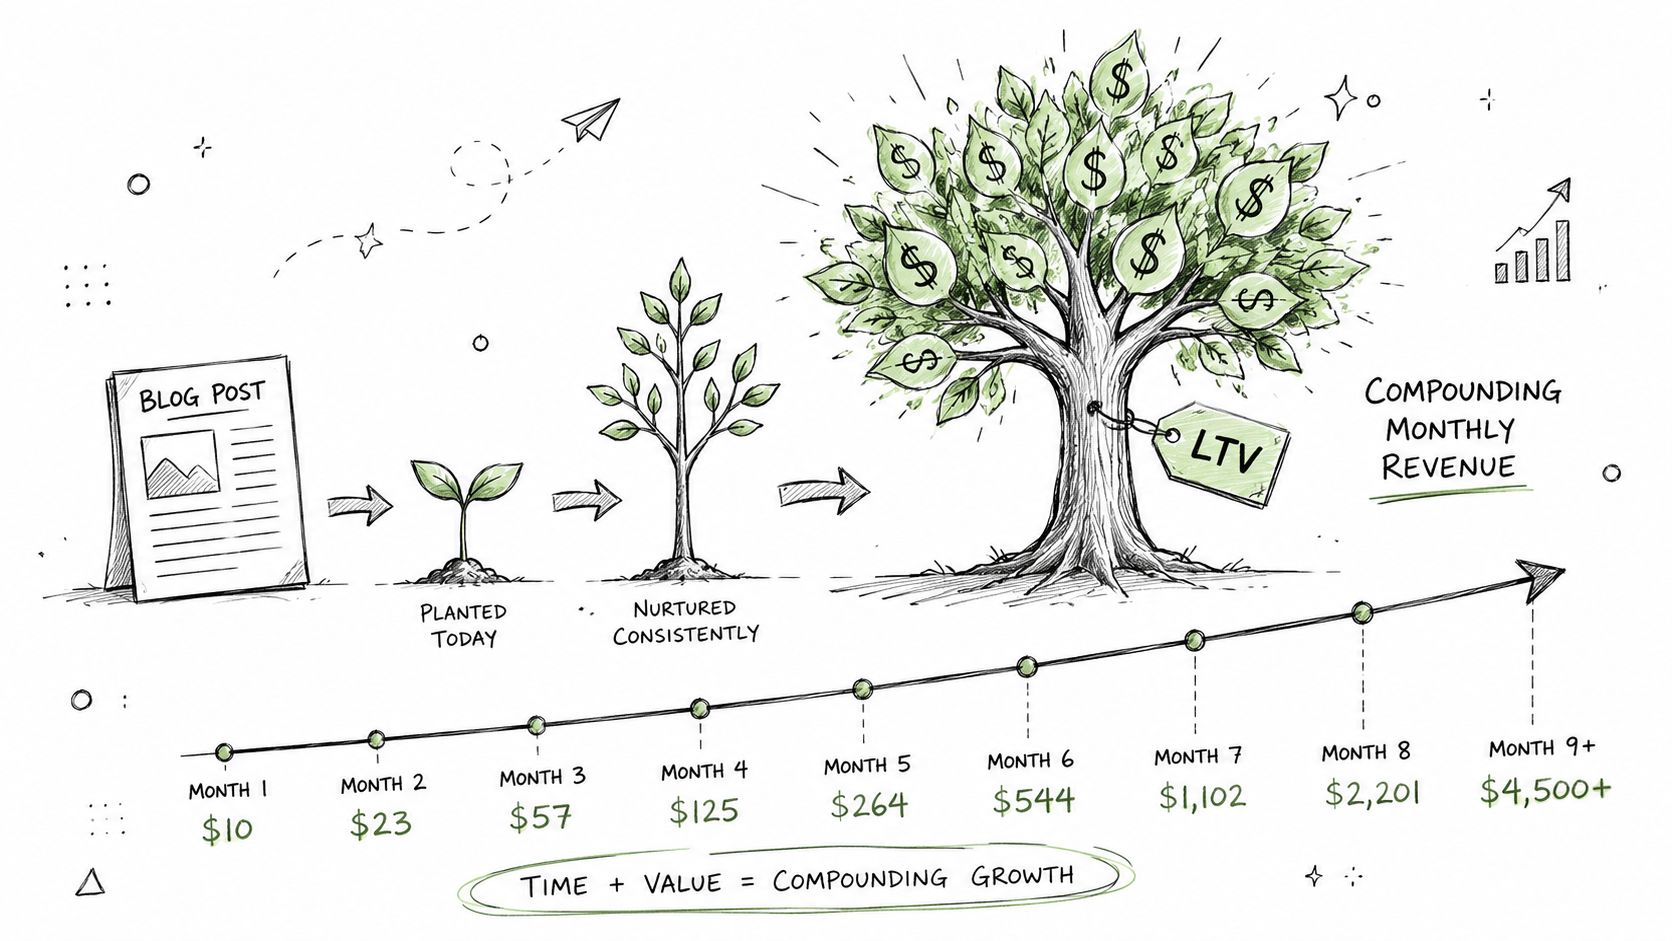
A content business should never let a weak 30-day dashboard kill a strong 12-month asset. If the work compounds, the math has to compound too.
The easiest way to ruin a ROI report is to let different mistakes stack up at once. I've seen teams celebrate a campaign that never beat baseline demand, never loaded the true costs, and then got measured inside a window that favored the fastest channel in the mix. That's how a vanity metric survives three meetings in a row.
Start with the symptom, then trace the cause, then apply the fix:
A mixed channel stack makes these errors even easier to miss. Paid social, search, and organic content all behave differently, so if your team uses the same shortcut everywhere, the dashboard starts lying by omission.
If you need the operational side handled cleanly, an marketing automation partner can help systematize the tagging and reporting so the numbers stop drifting between tools. That matters because manual reporting breaks exactly when scale starts to matter.
The right habit is simple. Before you trust any ROI number, ask five questions. Did we include all the costs, did we remove baseline sales, did the attribution window match the cycle, did we use the right formula for the margin structure, and did we keep the method consistent across dashboards?
Week one is about definitions, not dashboards. Decide the KPI for each channel, tag every campaign source, and write down whether the channel will be judged on revenue ROI, gross profit ROI, or LTV-adjusted ROI. If the team can't name the formula before launch, they don't deserve the result after launch.
Week two is where the cost sheet gets built. Add rows for media, creative, software, agency fees, internal labor, and overhead, then make one person responsible for updating it weekly. That single step will do more for measurement quality than a prettier reporting tool.
Week three is attribution. Set the window to match the sales cycle, then keep a shorter operational view and a longer strategic view side by side. If the channel is content-driven, add a trailing view so you don't bury delayed conversions.
Week four is the first real report. Publish revenue ROI, gross profit ROI, and, where content compounds, an LTV-adjusted view. The report should drive decisions on three things, where to reallocate spend, which content to retire, and which channels deserve more budget.
A basic spreadsheet layout can stay simple:
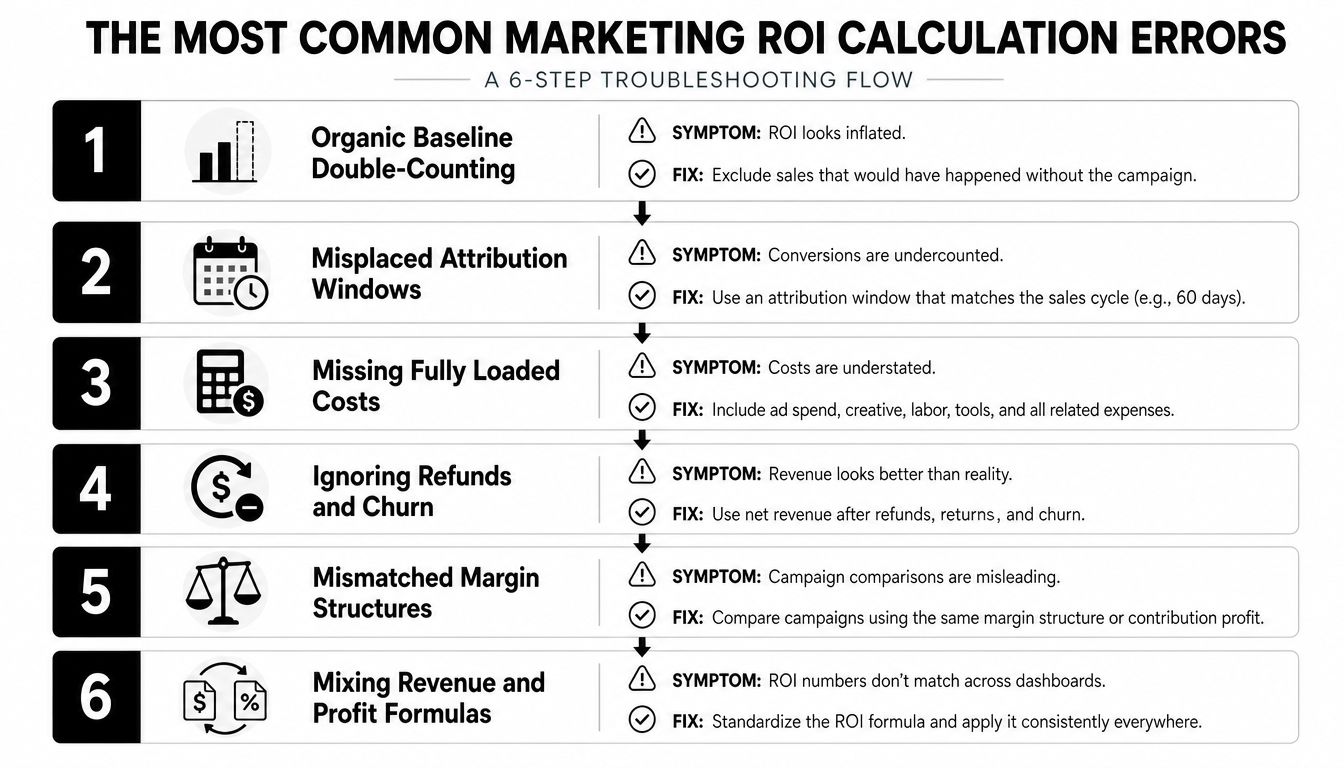
The fastest way to stop bad reporting is to keep a six-step check in front of the team: Organic Baseline Double-Counting, Misplaced Attribution Windows, Missing Fully Loaded Costs, Ignoring Refunds and Churn, Mismatched Margin Structures, and Mixing Revenue and Profit Formulas. If a report fails one of those checks, don't present it as fact.
If you want marketing ROI to behave like an operating system instead of a slide deck, build around the business model, not the easy metric. Legacy Builder helps founders and professionals turn their story, content, and positioning into a consistent system that's built for compounding influence. Visit Legacy Builder if you want a content engine that supports better measurement, not just more posts.


You could – but most in-house teams struggle with the nuance of growing on specific platforms.
We partner with in-house teams all the time to help them grow on X, LI, and Email.
Consider us the special forces unit you call in to get the job done without anyone knowing (for a fraction of what you would pay).
Short answer – yes.
Long answer – yes because of our process.
We start with an in-depth interview that gives us the opportunity to learn more about you, your stories, and your vision.
We take that and craft your content then we ship it to you. You are then able to give us the final sign-off (and any adjustments to nail it 100%) before we schedule for posting.
No problem.
We have helped clients for years or for just a season.
All the content we create is yours and yours alone.
If you want to take it over or work on transitioning we will help ensure you are set up for success.
We want this to be a living breathing brand. We will give you best practices for posting and make sure you are set up to win – so post away.
Subscribe to our newsletter and get insights on how to grow your personal brand.
